Punjab Wealth Comparison Calculator
Indian Punjab
State in northern India
Pakistani Punjab
Province of Pakistan
Key Insight
Indian Punjab has a higher per-capita income due to industrial diversification and higher agricultural yields.
Key Insight
Pakistani Punjab has a larger total GDP due to its much larger population and growing services sector.
Interactive Comparison
Economic Metrics Summary
| Metric | Indian Punjab | Pakistani Punjab |
|---|---|---|
| GDP (2024) | $115B | $215B |
| GDP per capita | $3,800 | $2,200 |
| Population | 30M | 110M |
| HDI (2023) | 0.743 | 0.654 |
| Growth Rate | 4.2% | 5.1% |
Conclusion
Indian Punjab leads in per-capita wealth and human development index, while Pakistani Punjab excels in total GDP due to its larger population and faster growth.
For investors seeking high-margin opportunities, Indian Punjab offers better returns. For those targeting scale and labor force, Pakistani Punjab provides greater potential.
Punjab GDP figures often dominate headlines, but the real story lies in how the two Punjabs compare across multiple economic dimensions. Below is a quick snapshot:
- Indian Punjab: Higher per‑capita income, stronger industrial base.
- Pakistani Punjab: Larger overall GDP, faster population growth.
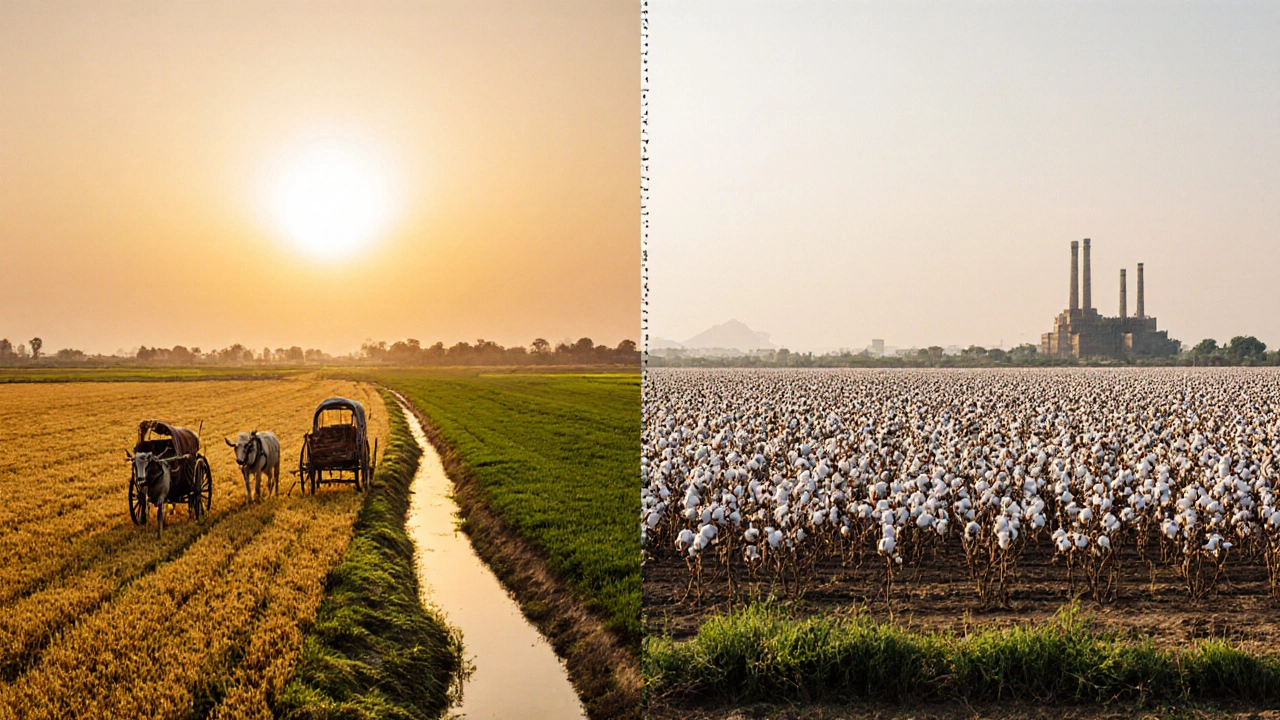
- Both: Agriculture remains the backbone, yet each region is diversifying.
Setting the scene: What is "Punjab"?
When most people say "Punjab," they are referring to two distinct administrative units that share a cultural heritage but belong to different nations. Indian Punjab is a state in northern India covering about 50,000 square kilometres, home to roughly 30million people. Across the border, Pakistani Punjab is a province of Pakistan, spanning 205,000 square kilometres with a population of over 110million.
Both regions were part of the historic Punjab Valley, famous for fertile soils, a rich cultural tapestry, and a history of trade. After the 1947 Partition, the valley split between the two new nations, setting the stage for divergent economic paths.
Key economic indicators (2024‑2025)
| Indicator | Indian Punjab | Pakistani Punjab |
|---|---|---|
| GDP (US$ billions, 2024) | ≈ 115 | ≈ 215 |
| GDP per capita (US$, 2024) | ≈ 3,800 | ≈ 2,200 |
| Population (2024) | ≈ 30million | ≈ 110million |
| Human Development Index (HDI, 2023) | 0.743 (high) | 0.654 (medium) |
| Annual growth rate (2023‑24) | ≈ 4.2% | ≈ 5.1% |
| Major sectors (% of GDP) | Agriculture 20%, Manufacturing 30%, Services 50% | Agriculture 15%, Manufacturing 25%, Services 60% |
Why Indian Punjab shows higher per‑capita wealth
Per‑capita income is a direct measure of how much economic value each resident enjoys. Indian Punjab’s per‑capita GDP of about US$3,800 outpaces Pakistani Punjab’s US$2,200 despite the latter’s larger total GDP. Two factors explain this gap:
- Industrial diversification - Indian Punjab hosts a robust textile, automobile parts, and food‑processing cluster centered around Ludhiana and Jalandhar. These high‑value factories lift average earnings.
- Higher agricultural yields - the Green Revolution left Indian Punjab with a modern irrigation network and a farm‑gate price system that pays growers better than the subsidised pricing model in Pakistani Punjab.
Both points are reflected in the Agriculture sector of Indian Punjab contributing 20% of GDP versus 15% in Pakistani Punjab, while the Manufacturing sector accounts for an extra 5% of value added.
Why Pakistani Punjab holds a larger total GDP
With more than three times the population, Pakistani Punjab naturally generates a bigger aggregate economy. Its rapid urbanisation, especially around Lahore, Faisalabad, and Rawalpindi, fuels a services boom that now makes up 60% of the province’s GDP. Moreover, Pakistani Punjab benefits from higher growth rates (over 5% annually) driven by:
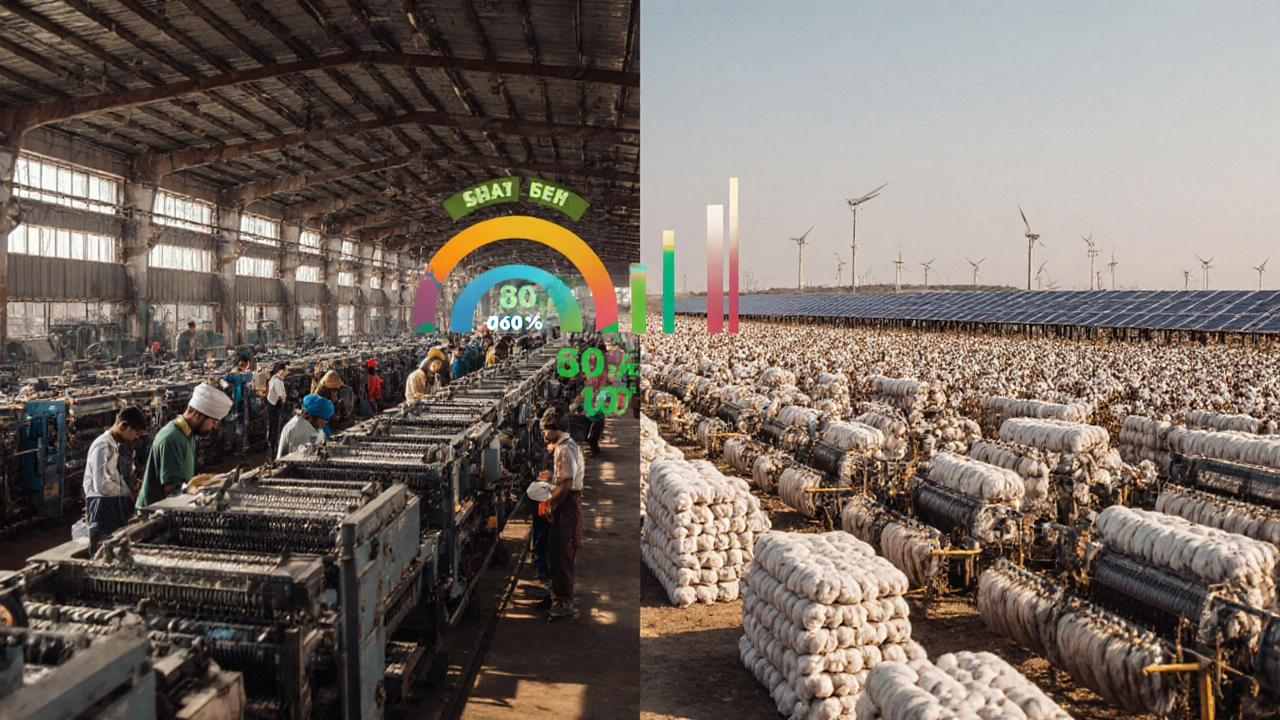
- Export‑oriented textile mills - Pakistan’s global cotton production translates into massive textile exports from Punjab.
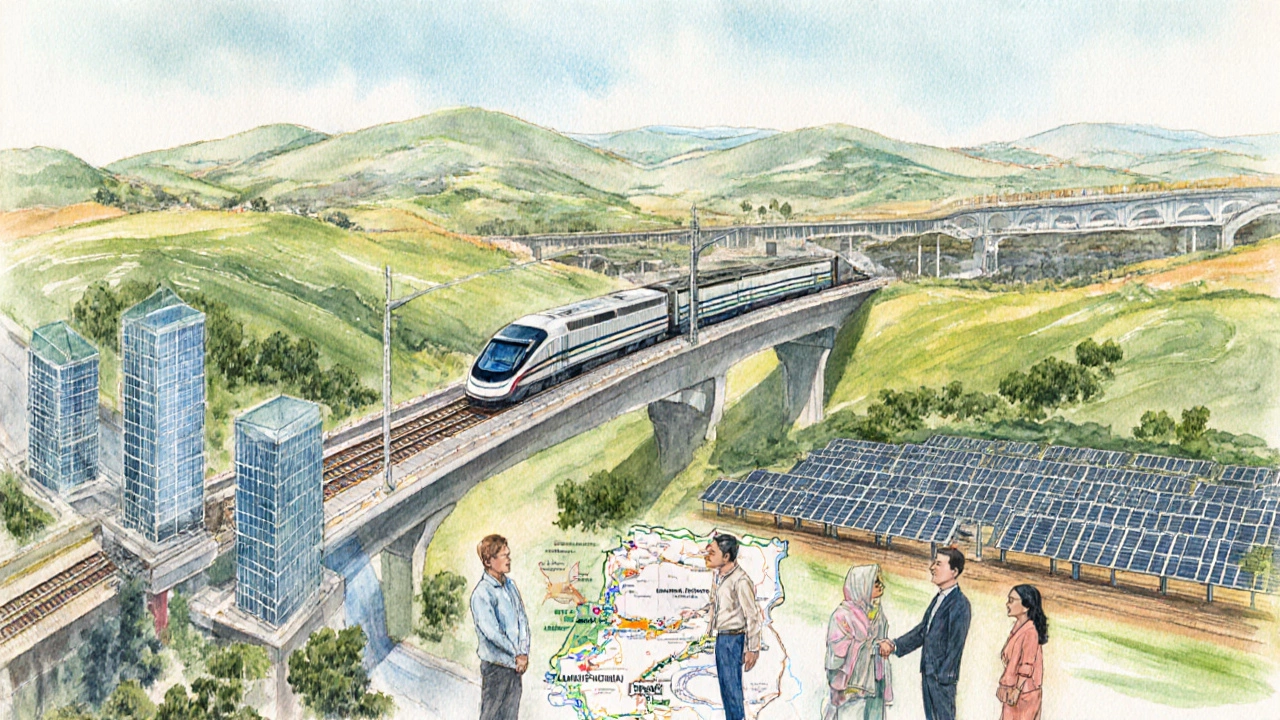
- Infrastructure projects - the China‑Pakistan Economic Corridor (CPEC) has upgraded highways and power plants, attracting foreign investment.
Even though the per‑capita figure lags, the sheer scale of production and a youthful labour force keep the total GDP ahead of its Indian counterpart.
Human Development Index: Quality of life matters
The HDI combines life expectancy, education, and income. Indian Punjab’s HDI of 0.743 places it in the "high" category, while Pakistani Punjab’s 0.654 remains "medium". The difference stems from:
- Education - Punjab (India) has a literacy rate above 80%, with a strong network of government schools and private colleges. Pakistani Punjab, though improving, still hovers around 68%.
- Health outcomes - the Indian state reports lower infant mortality and higher average life expectancy (≈ 71years vs. 68years).
Higher HDI scores translate into a healthier, more skilled workforce, which in turn supports higher wages and productivity.
Key sectors driving future wealth
Both Punjabs are shifting from pure agriculture to knowledge‑intensive services. Here’s what to watch:
- Information technology - Ludhiana’s tech parks are attracting startups focused on agri‑tech and e‑commerce.
- Renewable energy - Pakistani Punjab is installing solar farms under a national green‑energy policy, aiming to add 5GW by 2030.
- Logistics hubs - The new “Punjab Freight Corridor” links both regions to the Kartarpur railway, promising faster cross‑border trade.
These developments could narrow the per‑capita gap over the next decade, especially if Pakistani Punjab’s larger population can be upskilled.
Common misconceptions
1. "Pakistan’s Punjab is poorer because its GDP per capita is lower" - While per‑capita income is a crucial metric, total GDP matters for regional influence and investment. 2. "Indian Punjab dominates agriculture" - Both sides produce wheat and rice, but Pakistani Punjab’s cotton output is unmatched globally, feeding its textile powerhouse. 3. "Both Punjabs are equally developed" - Data on HDI, literacy, and health clearly show Indian Punjab pulling ahead on human development.
Quick decision guide: Which Punjab appears richer?
If you define "rich" by total economic output, Pakistani Punjab wins. If you measure wealth per person, quality of life, or purchasing power, Indian Punjab leads. For investors, the choice hinges on strategy:
- Targeting large‑scale manufacturing and export markets? Look at Pakistani Punjab’s massive labour pool and textile infrastructure.
- Seeking higher‑margin, technology‑driven ventures? Indian Punjab’s higher HDI and stronger services sector may offer better returns.
Next steps for readers
1. Check the latest government statistics - Both the Indian Ministry of Statistics and Pakistan’s Planning & Development Division release quarterly data. 2. Compare sector‑specific reports - For textiles, consult the Cotton India Annual; for IT, look at the NASSCOM state‑wise outlook. 3. Consider regional policies - Tax incentives, land‑lease schemes, and trade agreements can dramatically affect profitability. 4. If you’re planning a visit or a business trip, factor in visa rules, local infrastructure, and language (Punjabi is spoken on both sides, but official paperwork follows Hindi/English in India and Urdu in Pakistan).
Frequently Asked Questions
Which Punjab has a higher GDP per capita?
Indian Punjab, with about US$3,800 per person in 2024, outperforms Pakistani Punjab’s roughly US$2,200.
Why does Pakistani Punjab’s total GDP surpass that of Indian Punjab?
The larger population (≈110million vs. 30million) and a fast‑growing services sector generate a bigger aggregate economy despite lower per‑capita earnings.
How do HDI scores compare between the two Punjabs?
Indian Punjab scores 0.743 (high), while Pakistani Punjab records 0.654 (medium), reflecting better education, health, and life expectancy in the Indian side.
Which sector is the biggest growth driver for Pakistani Punjab?
Textile manufacturing, powered by Pakistan’s cotton production, remains the primary export engine, complemented by a rapidly expanding services sector.
What future trends could shift the wealth balance?
Investments in renewable energy, IT startups, and logistics corridors are set to boost productivity. If Pakistani Punjab successfully upskills its large labour force, per‑capita figures could narrow. Conversely, Indian Punjab’s push into high‑value manufacturing may widen its advantage in human development.